Are TikTok views lower in summer or December? We checked 545,592 videos
November 2026
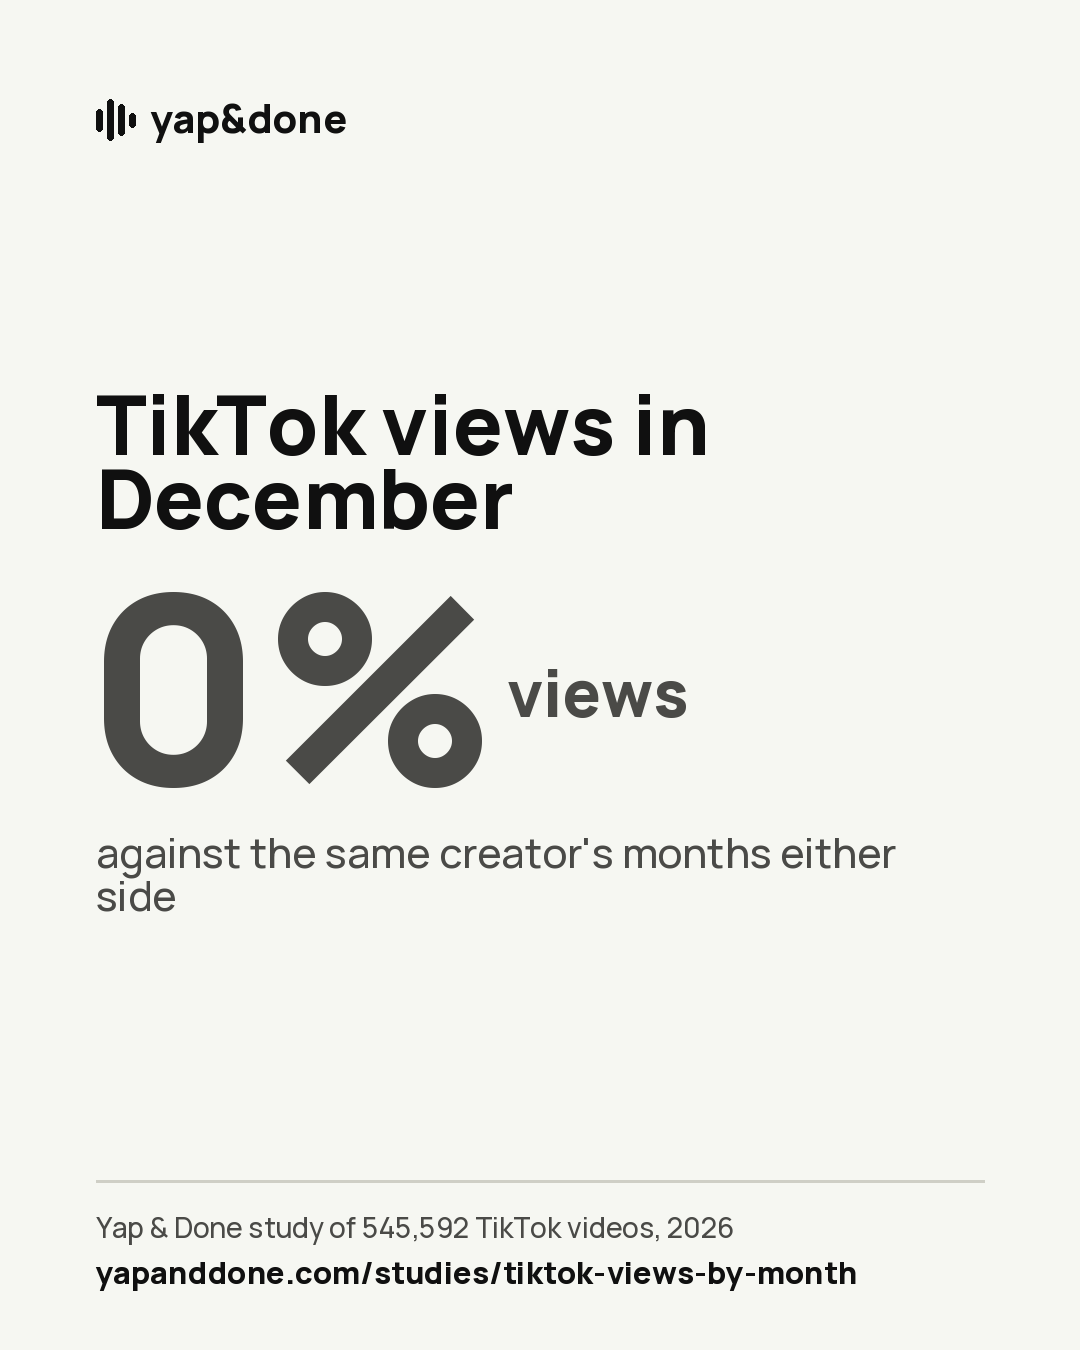
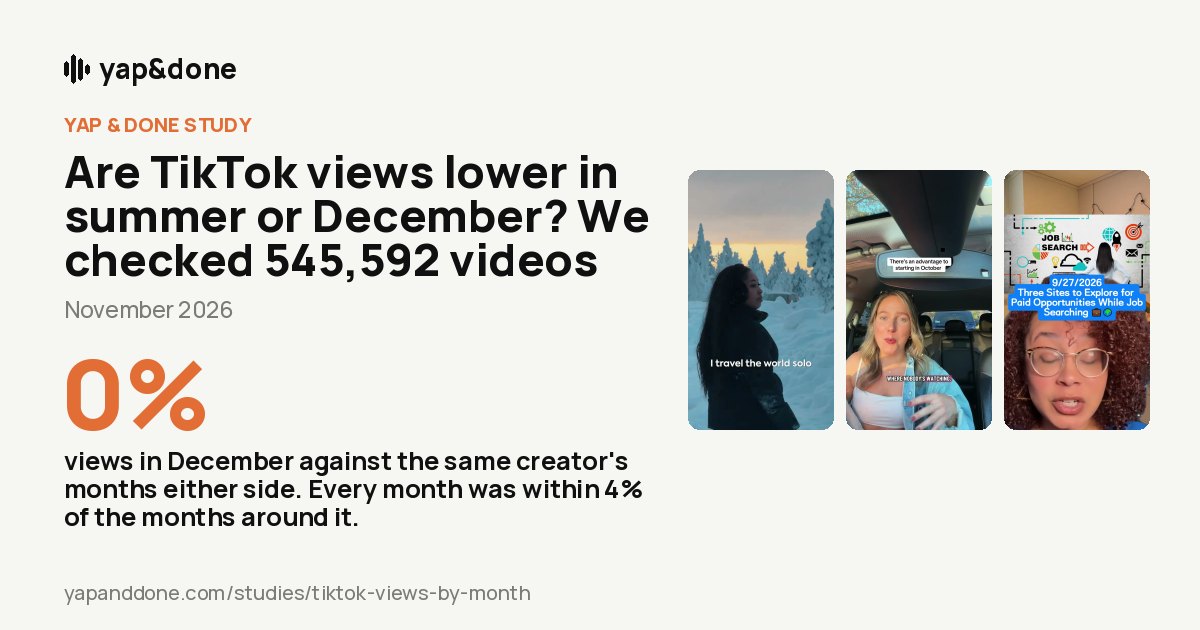
0%views in December against the same creator's months either side. Every month was within 4% of the months around it.



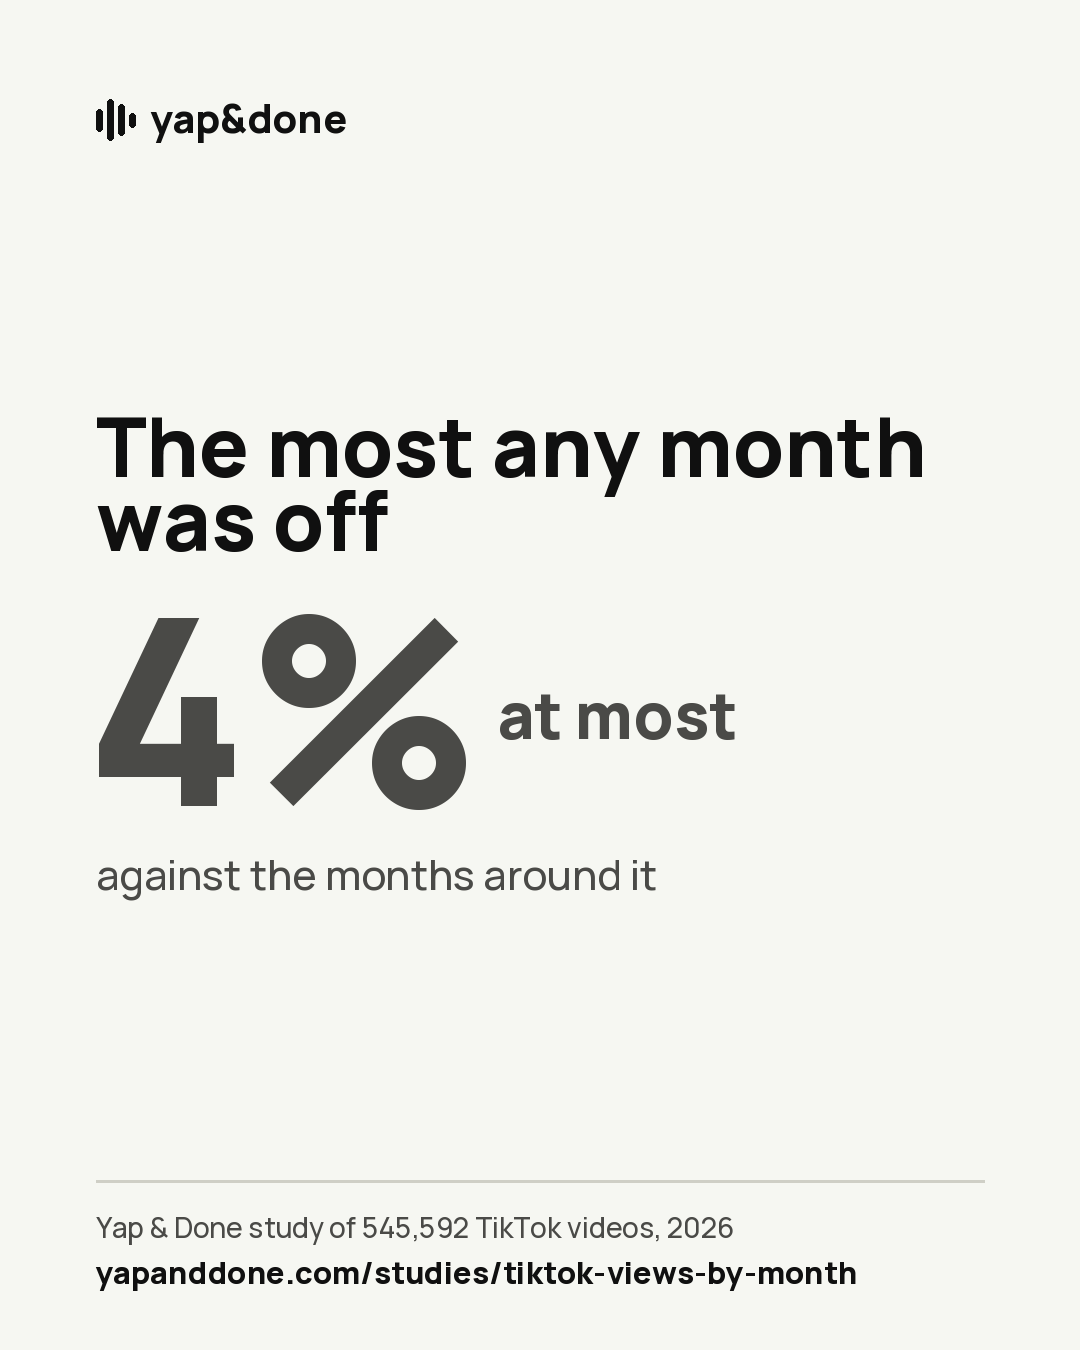
Creators blame slow months for slow views: the summer slump, the dead week after Christmas, everyone shopping on Black Friday. We compared each creator's views in every month with their own months either side. No month was more than +4% off.
The top lessons you can use
- Don't take months off for the "slow season". Every month was within 4% of the same creator's months either side; December was 0%.
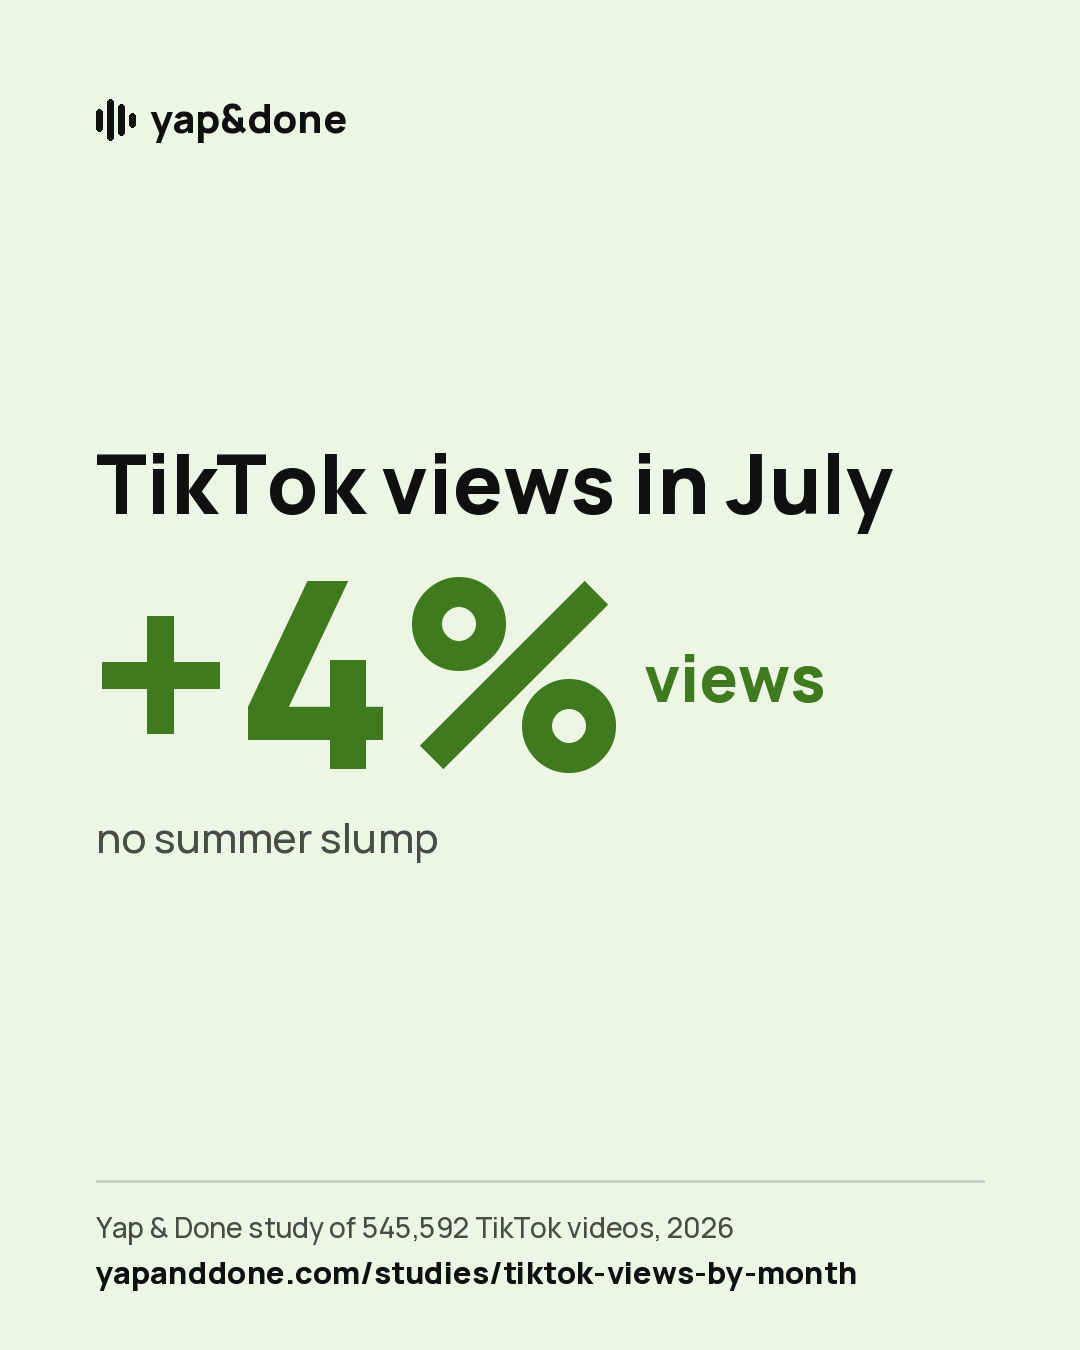
- There's no summer slump. June was 0%, July +4% and August +3%.
- Keep posting through the holidays. Christmas week was -1% and Thanksgiving week +3%; neither is a clear difference.
- If your views dropped this month, look at your videos before the calendar: the season explains a few percent at most.
Key points
Every month within 4% of the months around it.
July +4%, August +3%.
Christmas week -1%; Thanksgiving week +3%.
The specifics
No month was more than 4% off
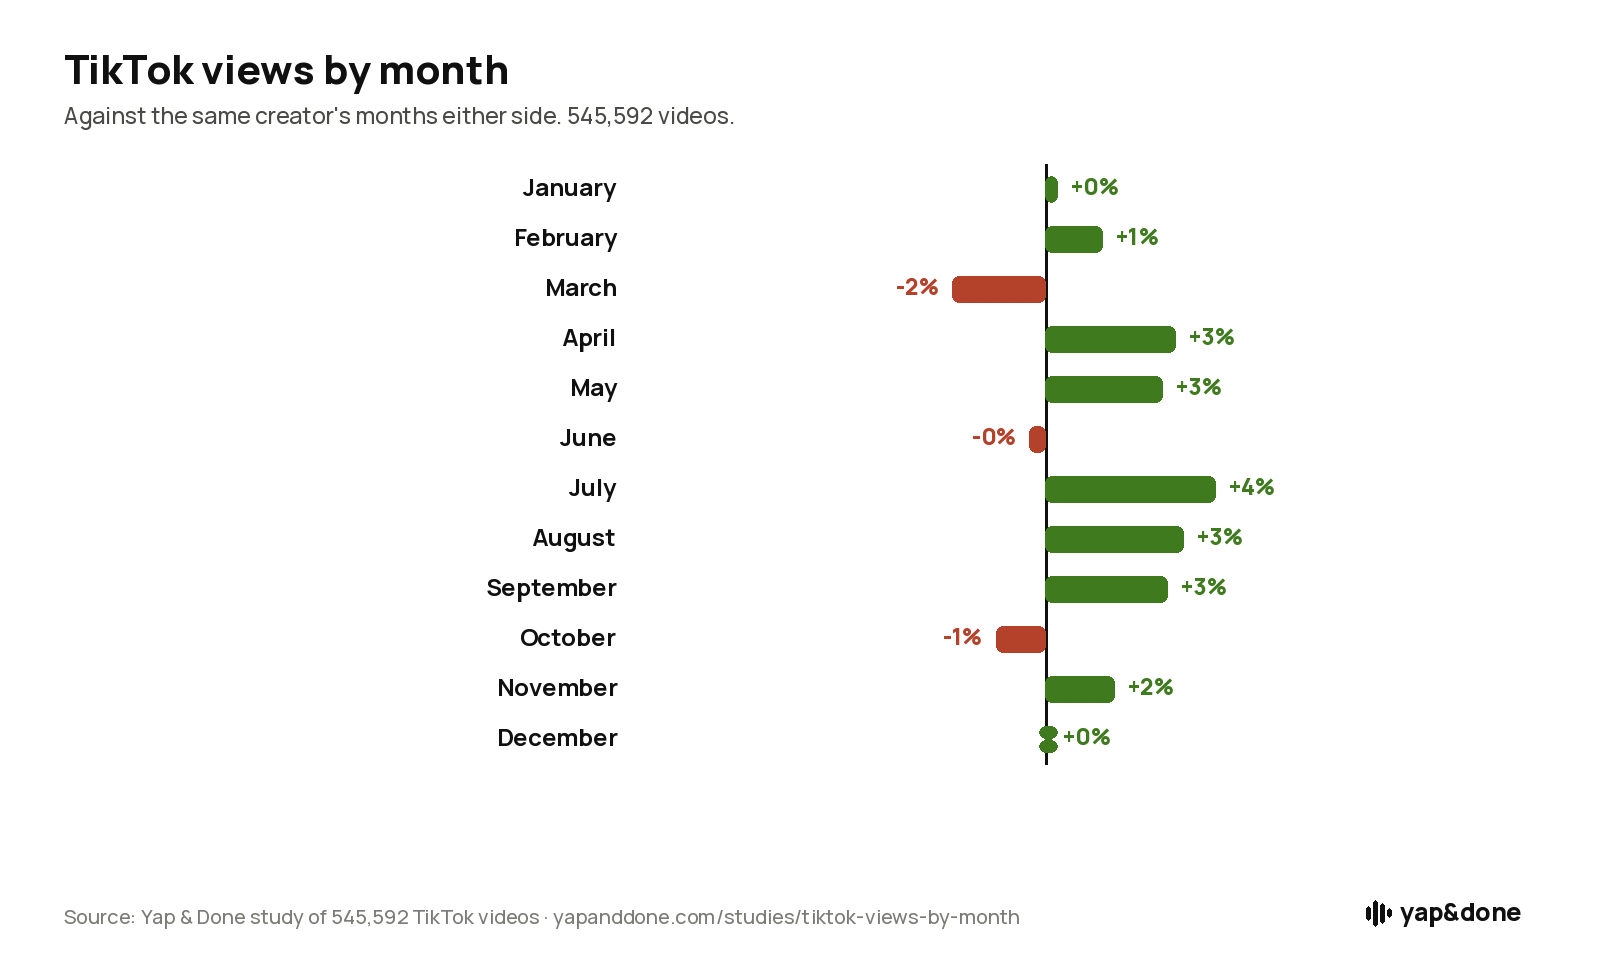
Comparing each creator's views in a month with their own months on either side, the best month was July (+4%, range +1% to 7%) and the weakest March (-2%). The other months sat in between, most within a few percent and several with no clear difference at all.
Summer is, if anything, slightly better
June got 0%, July +4% and August +3% against the creator's months around them. The "summer slump" doesn't show up in views per video.
December and the holidays hold up
December got 0%. Christmas week got -1% (range -6 to 5%), New Year week +3% and Thanksgiving week +3% against the 4 weeks either side. None is a clear difference.
Views by month on TikTok
Each creator's views per video in a month against their own months on either side (up to 3 each way).
Views against the months around it
By month
| Month | Views | 95% range | Creators |
|---|---|---|---|
| January | 0%* | -3% to +4% | 847 |
| February | +1%* | -2% to +5% | 931 |
| March | -2%* | -5% to +1% | 994 |
| April | +3% | +0% to +6% | 1,035 |
| May | +3%* | 0% to +6% | 1,098 |
| June | 0%* | -3% to +2% | 1,154 |
| July | +4% | +1% to +7% | 1,218 |
| August | +3% | +1% to +6% | 1,260 |
| September | +3% | 0% to +6% | 1,242 |
| October | -1%* | -5% to +2% | 741 |
| November | +2%* | -2% to +5% | 778 |
| December | 0%* | -3% to +4% | 819 |
* not a clear difference. January to September appear in both 2025 and 2026; October to December only in 2025 (January 2025 has no months before it).
Holiday weeks on TikTok
Views per video in the holiday week against the same creator's 4 weeks either side.
Holiday weeks
| Week | Views | 95% range | Creators |
|---|---|---|---|
| Valentine's week | +1%* | -3% to +5% | 820 |
| Easter week | +3%* | 0% to +7% | 893 |
| July 4th week (US) | -1%* | -4% to +3% | 1,049 |
| Late August (back to school) | +3%* | 0% to +7% | 1,165 |
| Thanksgiving and Black Friday week | +3%* | -2% to +9% | 629 |
| Christmas week | -1%* | -6% to +5% | 625 |
| New Year week | +3%* | -2% to +8% | 667 |
* not a clear difference.
Instagram Reels by month
The same comparison for 141 Instagram creators. Far fewer creators, so the ranges are wide and no month is a clear difference.
Instagram by month
| Month | Views | 95% range | Creators |
|---|---|---|---|
| January | -2%* | -20% to +20% | 40 |
| February | -3%* | -16% to +13% | 60 |
| March | +11%* | -4% to +28% | 64 |
| April | -1%* | -11% to +11% | 76 |
| May | +4%* | -6% to +15% | 90 |
| June | +11%* | 0% to +24% | 102 |
| July | +5%* | -3% to +15% | 121 |
| August | +1%* | -7% to +9% | 141 |
| September | -6%* | -13% to +2% | 135 |
| October | +3%* | -13% to +22% | 31 |
| November | -3%* | -18% to +14% | 30 |
| December | -20%* | -39% to +4% | 39 |
* not a clear difference.
Short answers from this study
Questions people ask
Is there a summer slump on TikTok?
Not in views per video. June got 0%, July +4% and August +3% against the same creator's months either side.
Are TikTok views lower in December?
No: December got 0% and Christmas week -1%, neither a clear difference.
What is the best month to post on TikTok?
It barely matters. July did best at +4%, and no month was more than 4% off the months around it.
Why are my views down this month then?
Usually it's the videos, not the month: most creators' views swing far more from video to video than from season to season.
Images to post, repost and embed
Free to use under CC BY 4.0. Keep the credit on the image, and link to yapanddone.com/studies/tiktok-views-by-month when you can. Feed cards are 4:5 for Instagram and LinkedIn; story cards are 9:16 for TikTok, Reels and Stories.



Charts for articles


A 30-second script from this study
Free to use for your own TikTok, Reel or Short. Please keep the credit on screen.
Hook (first 2 seconds): There is no summer slump on TikTok.
The number: We checked 545,592 TikToks across 22 months. Every month was within 4% of the months around it. December: 0%. July: +4%.
Show: The views-by-month chart: twelve bars all close to zero.
Takeaway: Your views aren't down because it's summer. Keep posting.
On screen: Source: Yap & Done study, yapanddone.com/studies/tiktok-views-by-month
As data: script.json.
More on timing
Our posting-habits study covers the best time of day and day of the week.
How often should you actually post? Why are my TikTok views down?How we did it
- Videos: 545,592 TikToks and 29,906 Instagram Reels posted January 2025 to October 2026 by 1,709 TikTok and 306 Instagram creators across 10 niches, from their full back catalogues (the follower study's harvest, November 2026). Videos found through search because they did well, and videos under 2 weeks old, were left out.
- Months: each creator's average log views per video in a month (at least 3 videos), minus their average over the months on either side (up to 3 each way, at least one before and one after), so the long-run change in views doesn't pass for a season. Averaged across creators.
- Holiday weeks: the same, a Monday-to-Sunday week against the 4 weeks either side.
- Ranges are 95% ranges across creators. Views were counted in November 2026, so older videos have had longer to collect views; comparing neighbouring months keeps that difference small.
Limitations
- Views per video only. Pay per view (which advertisers drive) may still change by season; our pay study doesn't have enough months to say.
- Under two years of data, so each calendar month appears once or twice; a single unusual month (an app update, a news event) can move it.
- Mostly US and UK advice creators; holidays elsewhere aren't covered.
Use it, cite it
The aggregated results are free to reuse under CC BY 4.0. Journalists, researchers and AI agents can pull the full numbers below; the plain-text summary contains the whole study.
Cite as
Press questions or a custom cut of the data: contact us. We refresh this study each quarter; this page always shows the latest snapshot.