How often should you actually post?
November 2026
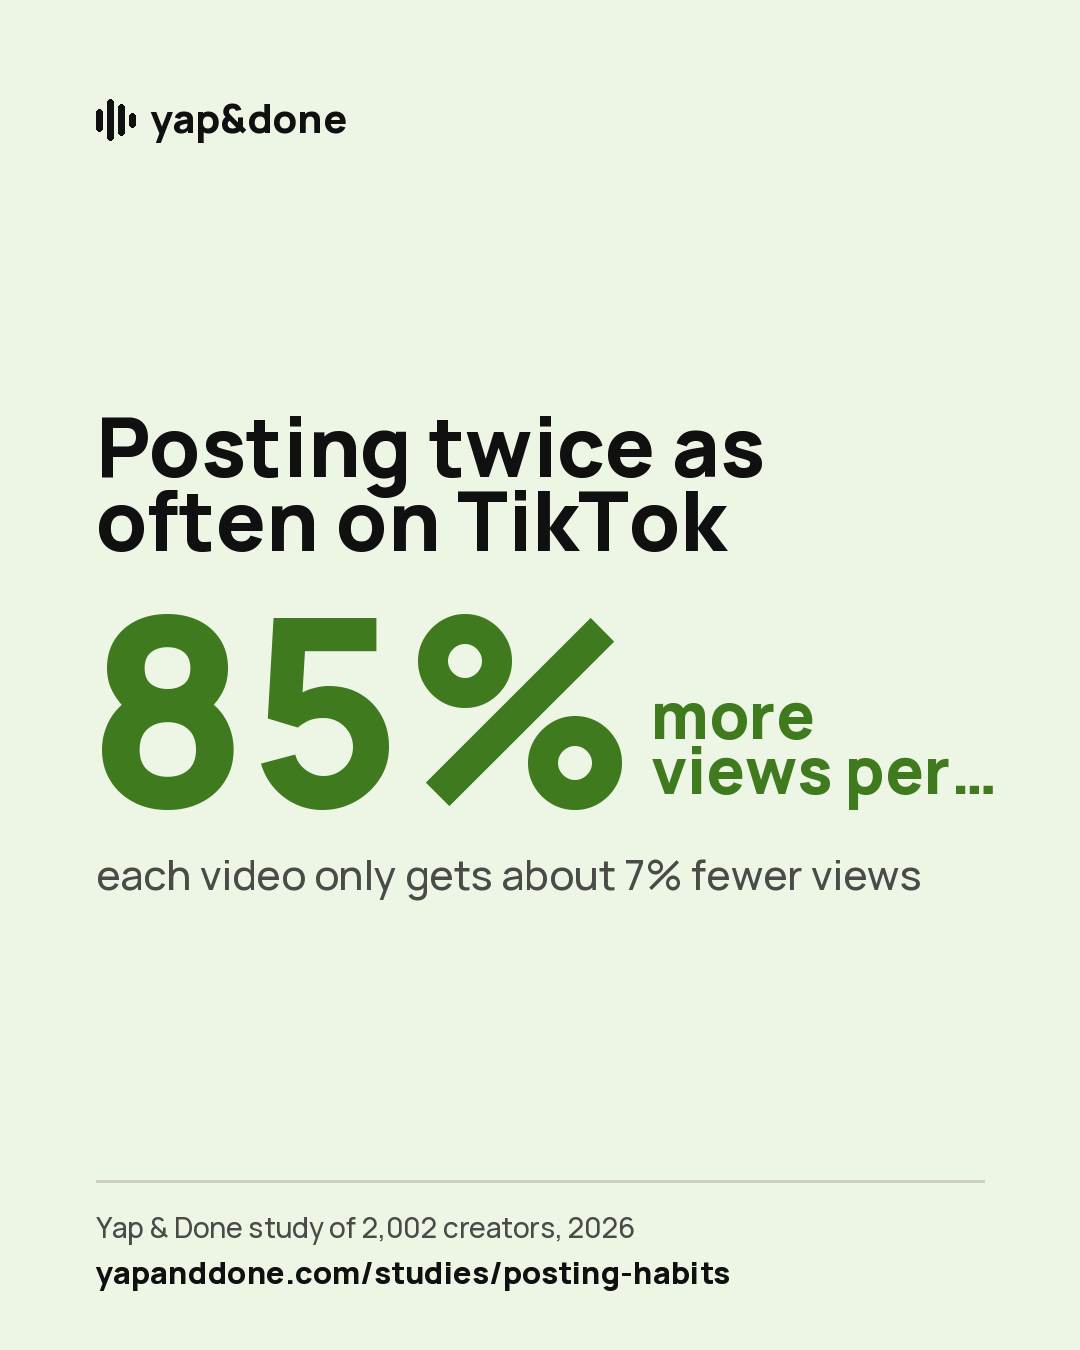
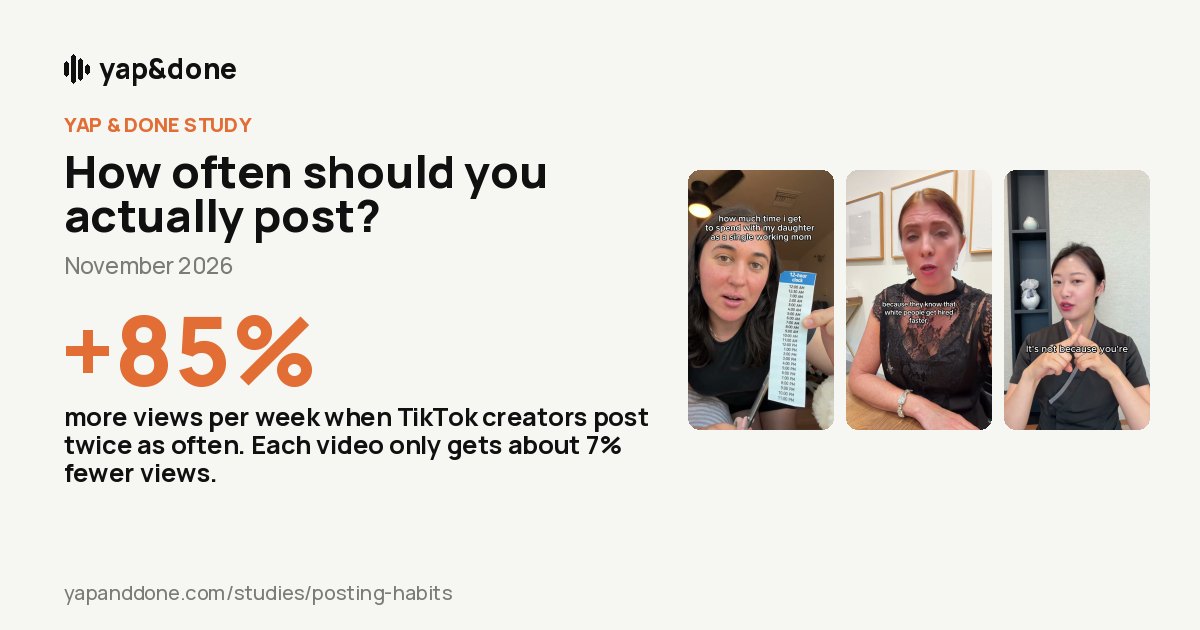
+85%more views per week when TikTok creators post twice as often. Each video only gets about 7% fewer views.


Should you post every day? Does a break hurt? What should you do after a video blows up, and when should you post? We tracked 563,180 videos from 2,002 creators to find out.
The top lessons you can use
- Post more often on TikTok. Doubling how much you post only trims each video's views by about 7%, so your total weekly views nearly double.
- Go easier on Instagram. There, doubling how much you post cut each Reel's views by about 19%.
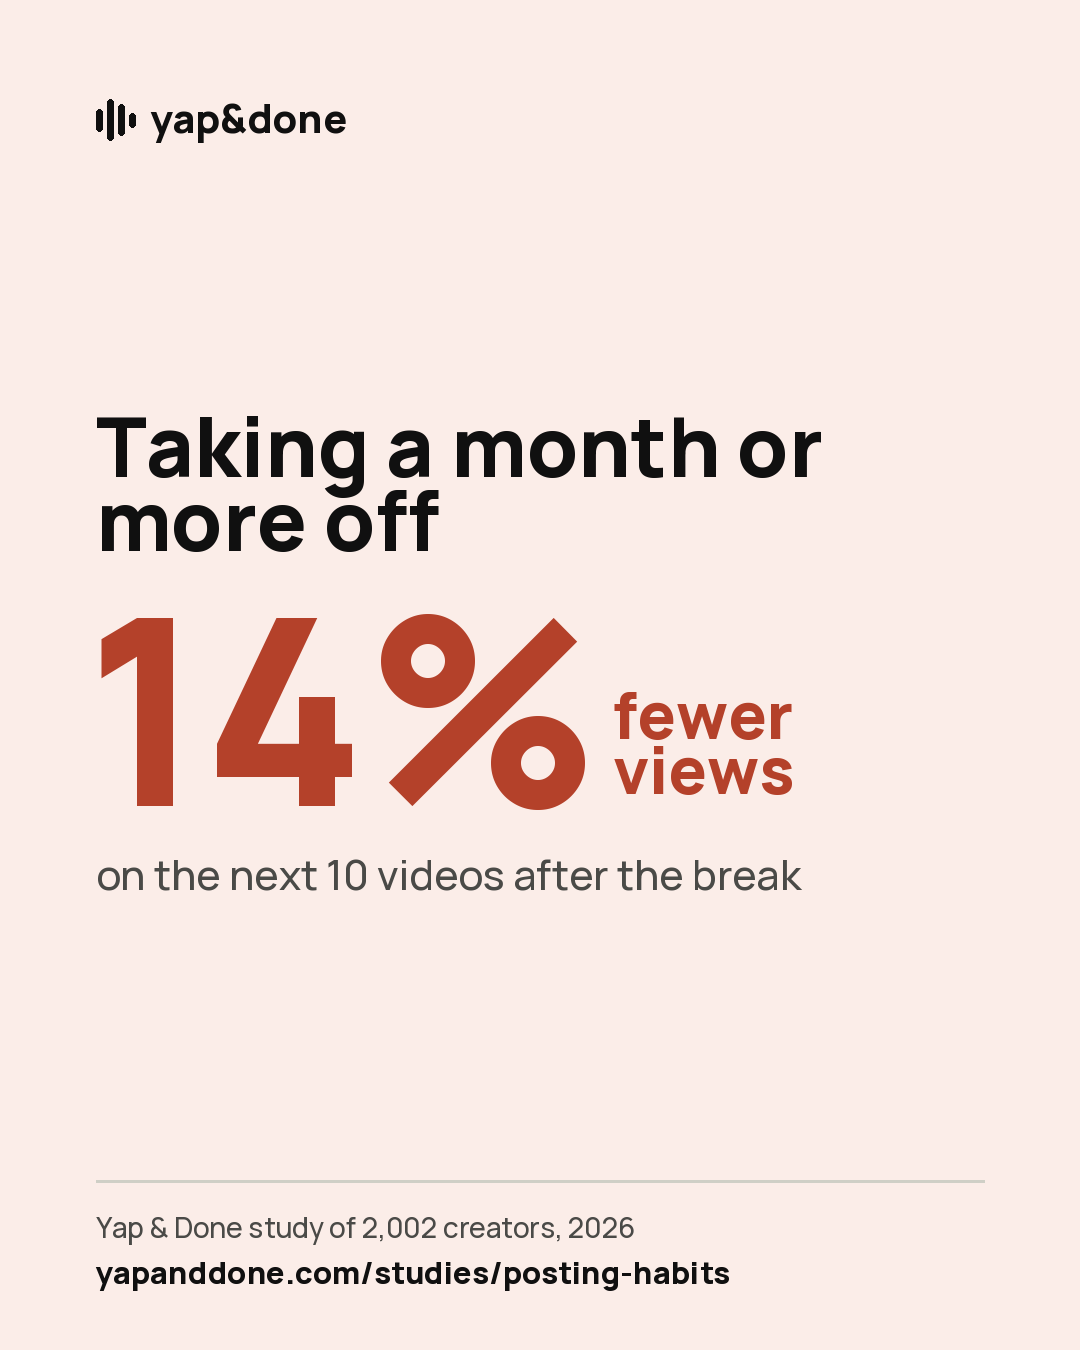
- Avoid breaks longer than a month. After 4+ weeks off, views stayed about 14% lower for the next 10 videos.
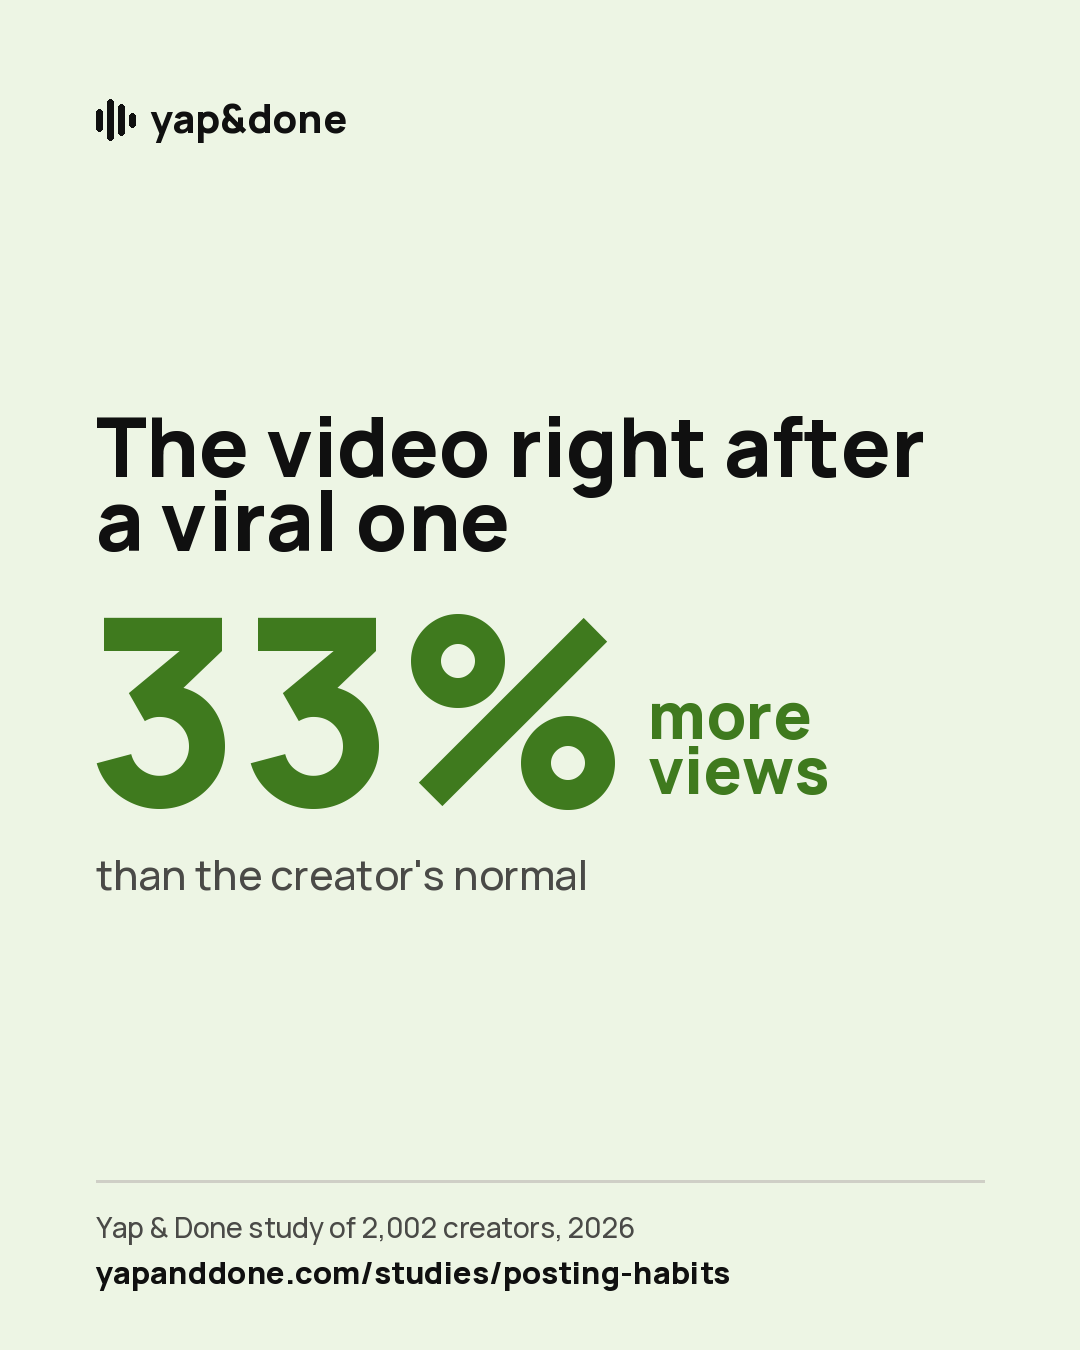
- When a video takes off, post again soon. The next video gets about 33% more views than normal, and the boost lasts for weeks.
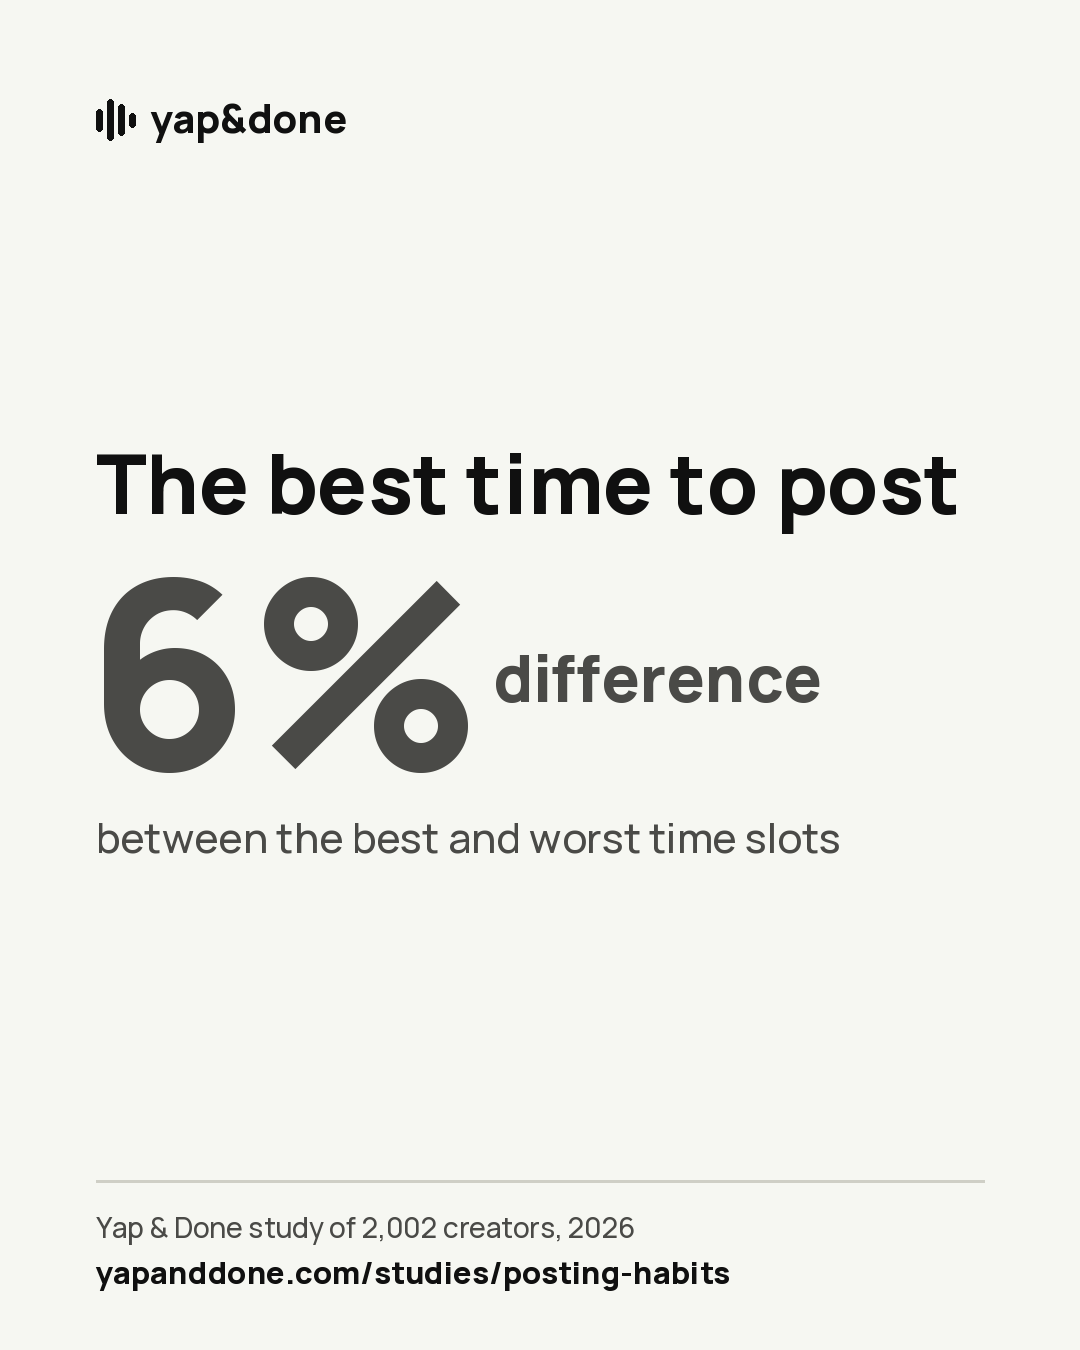
- Don't stress about the time of day. The best and worst time slots differ by only about 6%.
Key points
On TikTok, posting twice as often costs each video only about 7% of its views, so total weekly views go up about 85%.
On Instagram, posting twice as often costs each Reel about 19% of its views. Twice-a-day weeks did worst.
After a break of a month or more, a creator's videos got about 14% fewer views for the next 10 posts. A 2–4 week break barely mattered at first.
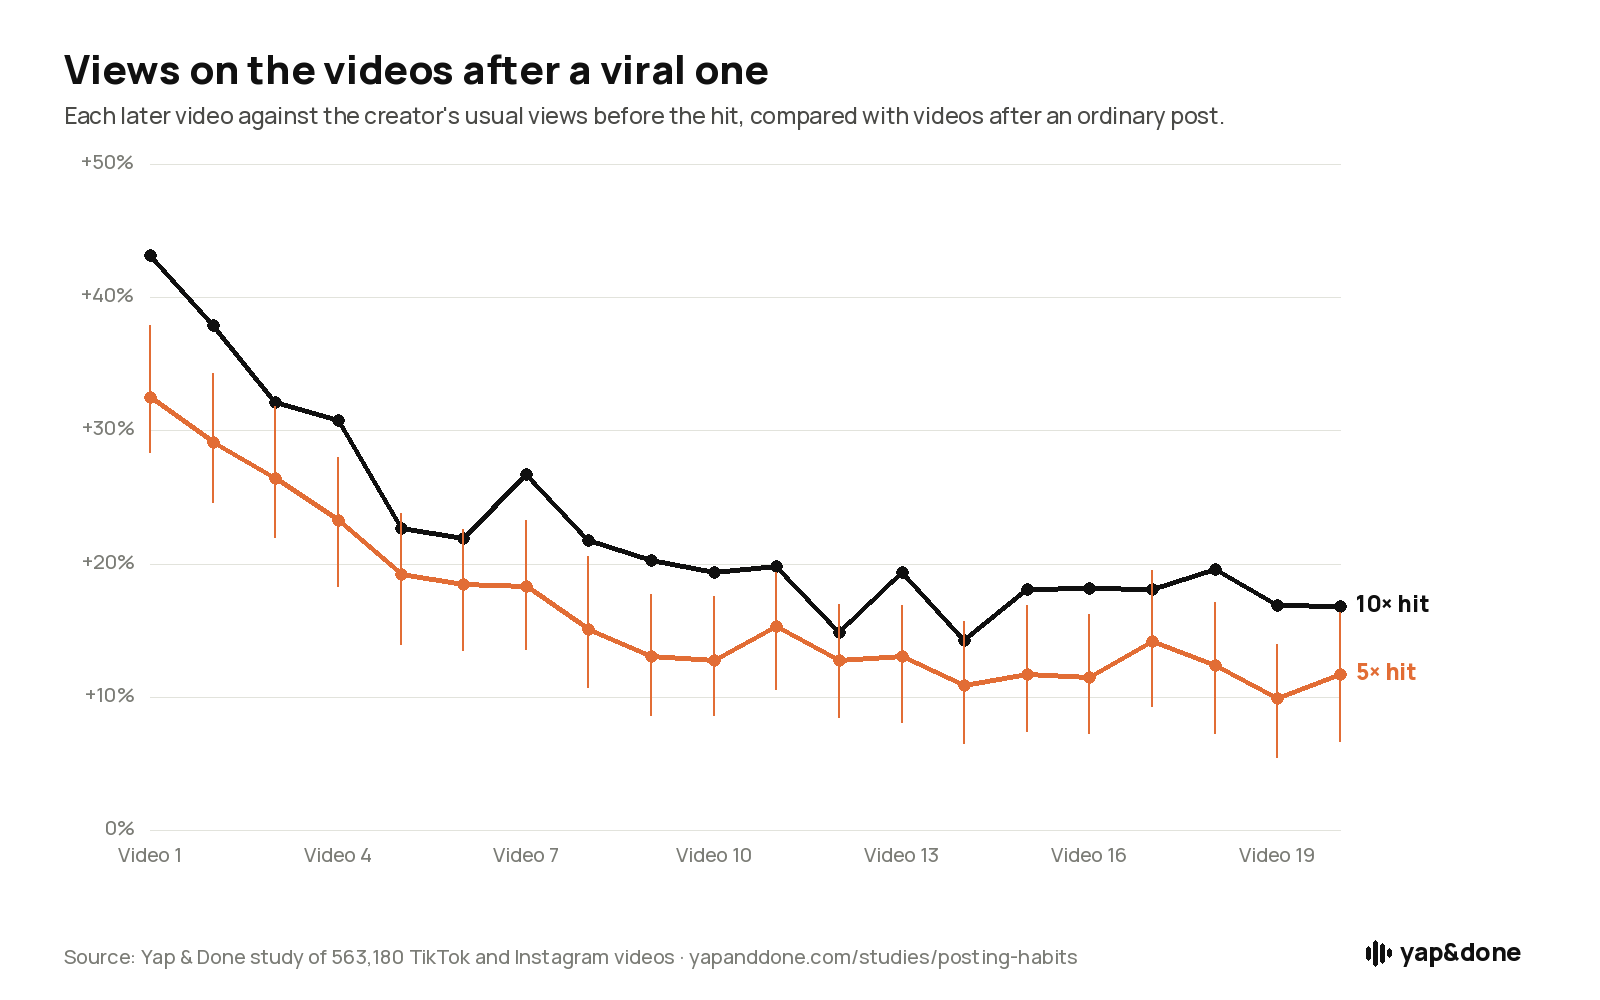
The video right after a viral one gets about 33% more views than normal (43% after a 10× hit), and you're still about 12% up 20 videos later.
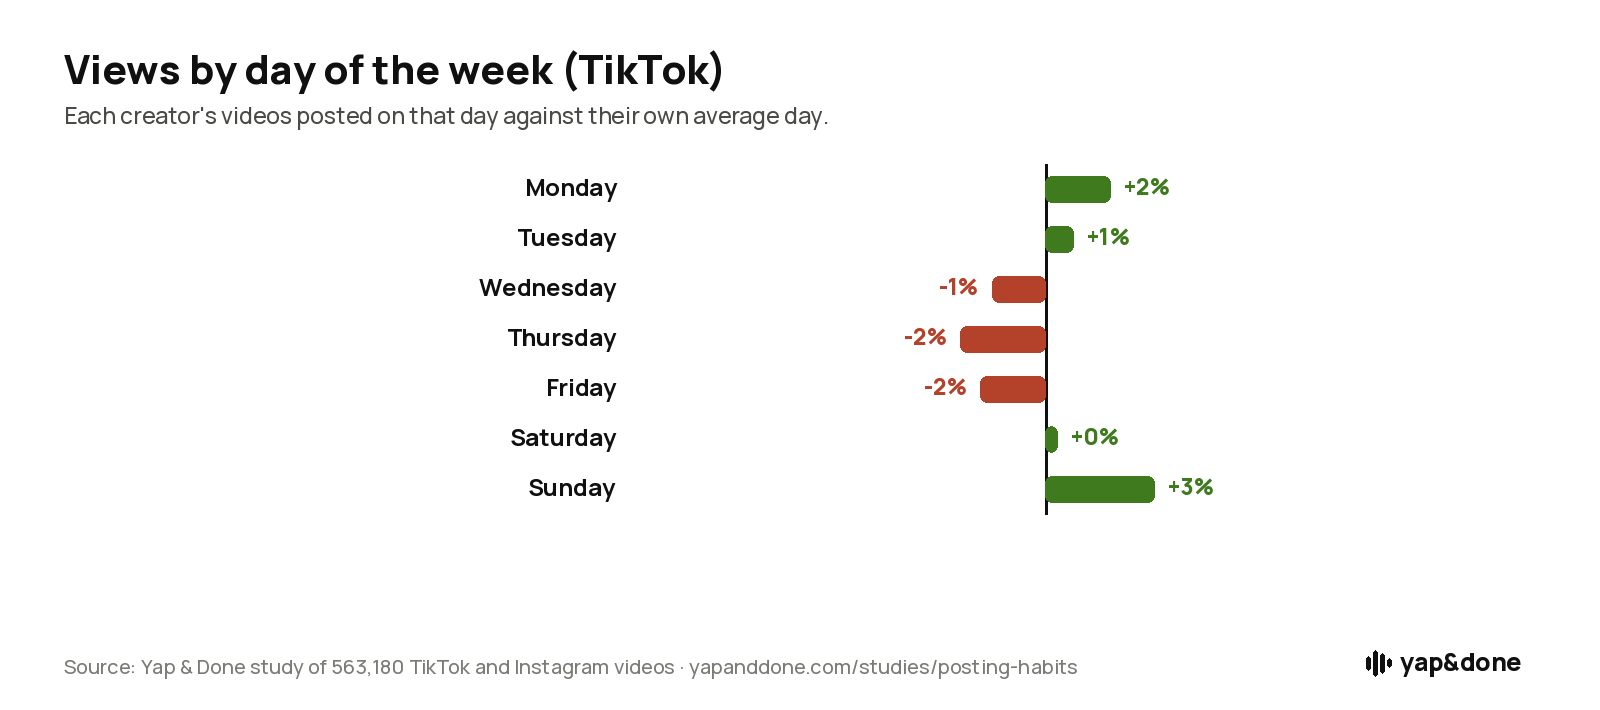
Every time slot and weekday was within a few percent of the creator's average. Best: Sunday (+3%) and 9–11am (+2%).
The typical creator posts about 5 times in a week they're active, and 35% average daily or more.
The specifics
Posting twice as often costs each video only 7%
We compared each TikTok creator's busy weeks with their own quiet weeks. When a creator posted twice as many videos in a week, each video got about 7% fewer views, so their typical weekly total went up about 85%. Posting a lot one week didn't hurt the next week either (−1%).
More posts means more chances to go viral
Counting every view (including the occasional hit), a week with twice the posts brought in about 137% more views, because each extra video is another chance for one to take off. Even weeks with 15 or more posts only cost each video about 9%.
Instagram punishes heavy posting more
On Instagram, posting twice as often cut each Reel's views by about 19%, and twice-a-day weeks got 22% fewer views per Reel than the same creator's average week. Total weekly views still went up (about 61% when doubling), just much less than on TikTok.
A month off costs you views
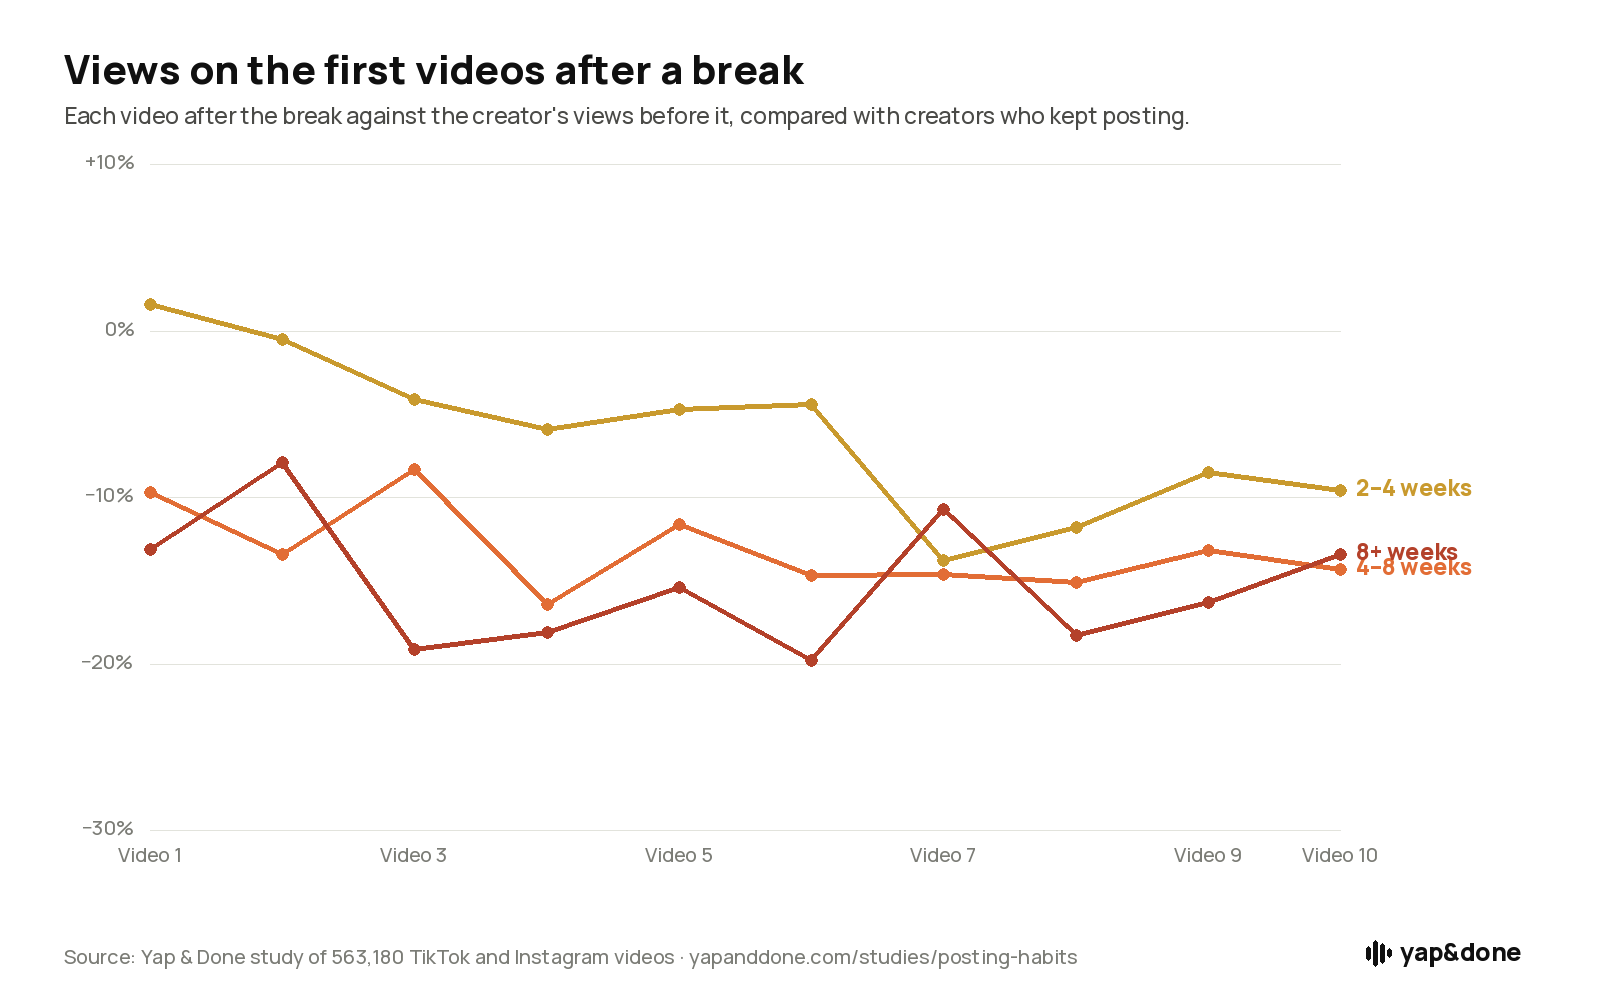
After a break of 4–8 weeks, a creator's next 10 videos got about 13% fewer views than before the break; after 8+ weeks, about 15% fewer. A 2–4 week break barely mattered for the first video back (+2%), though views slipped over the next few. Creators weren't already declining before they stopped, so the drop isn't just a slump that was already happening.
After a viral video, keep posting
The video right after one that got 5× the creator's usual views got about 33% more views than normal; after a 10× hit, about 43% more. The boost fades slowly: about 13% after 10 videos and still about 12% after 20, likely from the new followers the hit brought in.
The "best time to post" barely matters
Comparing each creator's videos posted at different times, every 3-hour slot and weekday was within about 3% of their average. The best were Sunday (+3%) and 9–11am (+2%); the weakest Thursday (−2%) and 5–8am (−3%). Post when you can be consistent.
More posts, slightly fewer views each, many more in total
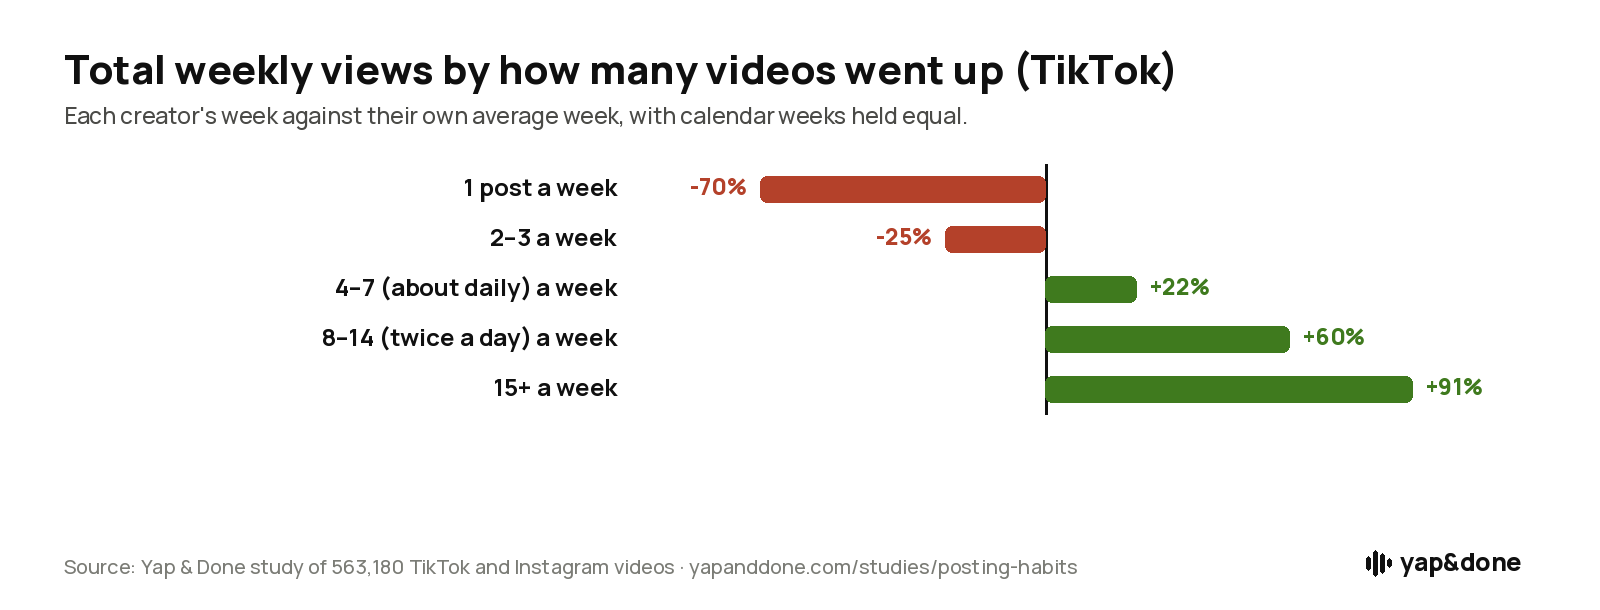
We compared each creator's weeks with their own average week. Green means more views than their usual week; red means fewer.
TikTok: views per video
TikTok: total views that week
Instagram: views per Reel
Instagram: total views that week
Each bar compares a creator's weeks with that many posts against the same creator's average week, with calendar weeks held equal so platform-wide ups and downs cancel out.
A month or more off costs about 15% of your views
Views on each of the first 10 videos after a break, compared with the creator's views just before it, and with creators who kept posting. Below the 0% line means fewer views than before the break.
TikTok only. Creators weren't already sliding before their breaks, so the drop comes after the break, not before it.
The best time to post barely matters
Each creator's videos posted in each time slot and on each day, compared with their own average. Local time in the creator's country.
Time of day
Day of the week
TikTok, 1,475 creators. Bars run from −10% to +10%; every slot is within a few percent of the creator's average.
Short answers from this study
Questions people ask
How often should I post on TikTok?
As often as you can keep quality up. Doubling how much you post only trims each video's views by about 7%, so your total weekly views nearly double. Most creators in our study post about 5 times in an active week.
Does posting too much hurt on Instagram?
More than on TikTok. Doubling how much you post cut each Reel's views by about 19%, and twice-a-day weeks did worst. Total weekly views still rose, so it's a trade-off: more Reels, fewer views each.
Will taking a break hurt my account?
A short one barely matters. After 4+ weeks off, though, a creator's next 10 videos got about 14% fewer views than before the break.
What should I do after a video goes viral?
Keep posting. The next video gets about 33% more views than your normal, and you're still about 12% up 20 videos later.
What's the best time to post on TikTok?
It barely matters. Comparing each creator's own videos, every time slot and weekday was within about 3% of their average. Sunday and 9–11am were slightly better; Thursday and 5–8am slightly worse.
Do posting a lot of videos "cannibalize" each other?
Only slightly within the same week (about 7% per video when doubling), and not at all into the following week (−1%).
Images to post, repost and embed
Free to use under CC BY 4.0. Keep the credit on the image, and link to yapanddone.com/studies/posting-habits when you can. Feed cards are 4:5 for Instagram and LinkedIn; story cards are 9:16 for TikTok, Reels and Stories.




Charts for articles


Posting more only helps if the videos are good
Our other studies look at what makes each video work: followers, the hook and the captions.
Does having followers actually get you more views? What makes a hook actually work?How we did it
- Creators and videos: the same 1,699 TikTok and 303 Instagram creators as our follower study, every account our niche miner had screened as genuinely in one of 10 niches, at any size. We collected their posts back to January 2025 (up to about 1,000 per creator on TikTok; on Instagram, their latest 100 or so Reels) and left out videos under 14 days old, pinned videos, ads, and the video we first found each creator through.
- How often: each creator's weeks (Monday to Sunday) with how many videos went up and the median views per video. A regression of log views per video on log posts that week, with each creator and each calendar week held fixed, gives the change for doubling. TikTok: −7% per video (95% range −9% to −6%), across 79,607 creator-weeks from 1,530 creators. The lagged check uses last week's posting against this week's views.
- Breaks: every gap of 2+ weeks between two posts (2,141, 732 and 444 cases). Each video after the break is compared with the creator's median over their 10 videos before it, minus the same comparison at ordinary points where the creator posted within 3 days. Before-break trend check: the last 5 videos against the 5 before them, against the same at ordinary points (+1% to +3%).
- After a viral video: a video with at least 5× (or 10×) the median of the creator's previous 10 videos (56,525 and 32,064 cases). The next 20 videos are compared with that median, minus the same for videos at the creator's usual level. Creators were on a slight upswing before the hit (+7%), so part of the boost is momentum.
- Time and day: each video against the median of the creator's other videos within ±30 days, by local time (from the creator's country; US creators on Central time), then each slot against that creator's own average slot. 1,475 creators who posted in at least two time slots.
- Ranges are 95% ranges from resampling creators 200 times (breaks and viral) or from the spread across creators (timing).
Limitations
- Observational data: busy weeks, breaks and viral hits aren't random. Creators often post more when things are going well, which may make heavy posting look slightly better than it is; the next-week check suggests it doesn't hurt.
- A "break" can also be videos the creator deleted or made private, which would look like a gap.
- US creators span several time zones, so their local times can be off by an hour or two.
- Instagram data covers each creator's latest 100 or so Reels, so breaks and viral follow-ups are measured on TikTok only.
- English-language talking-head creators in 10 niches; other kinds of accounts may differ.
Use it, cite it
The aggregated results are free to reuse under CC BY 4.0. Journalists, researchers and AI agents can pull the full numbers below; the plain-text summary contains the whole study.
Cite as
Press questions or a custom cut of the data (a niche, a platform, an account size): contact us. We refresh this study each quarter; this page always shows the latest snapshot.