How many views and likes should you actually be getting?
November 2026
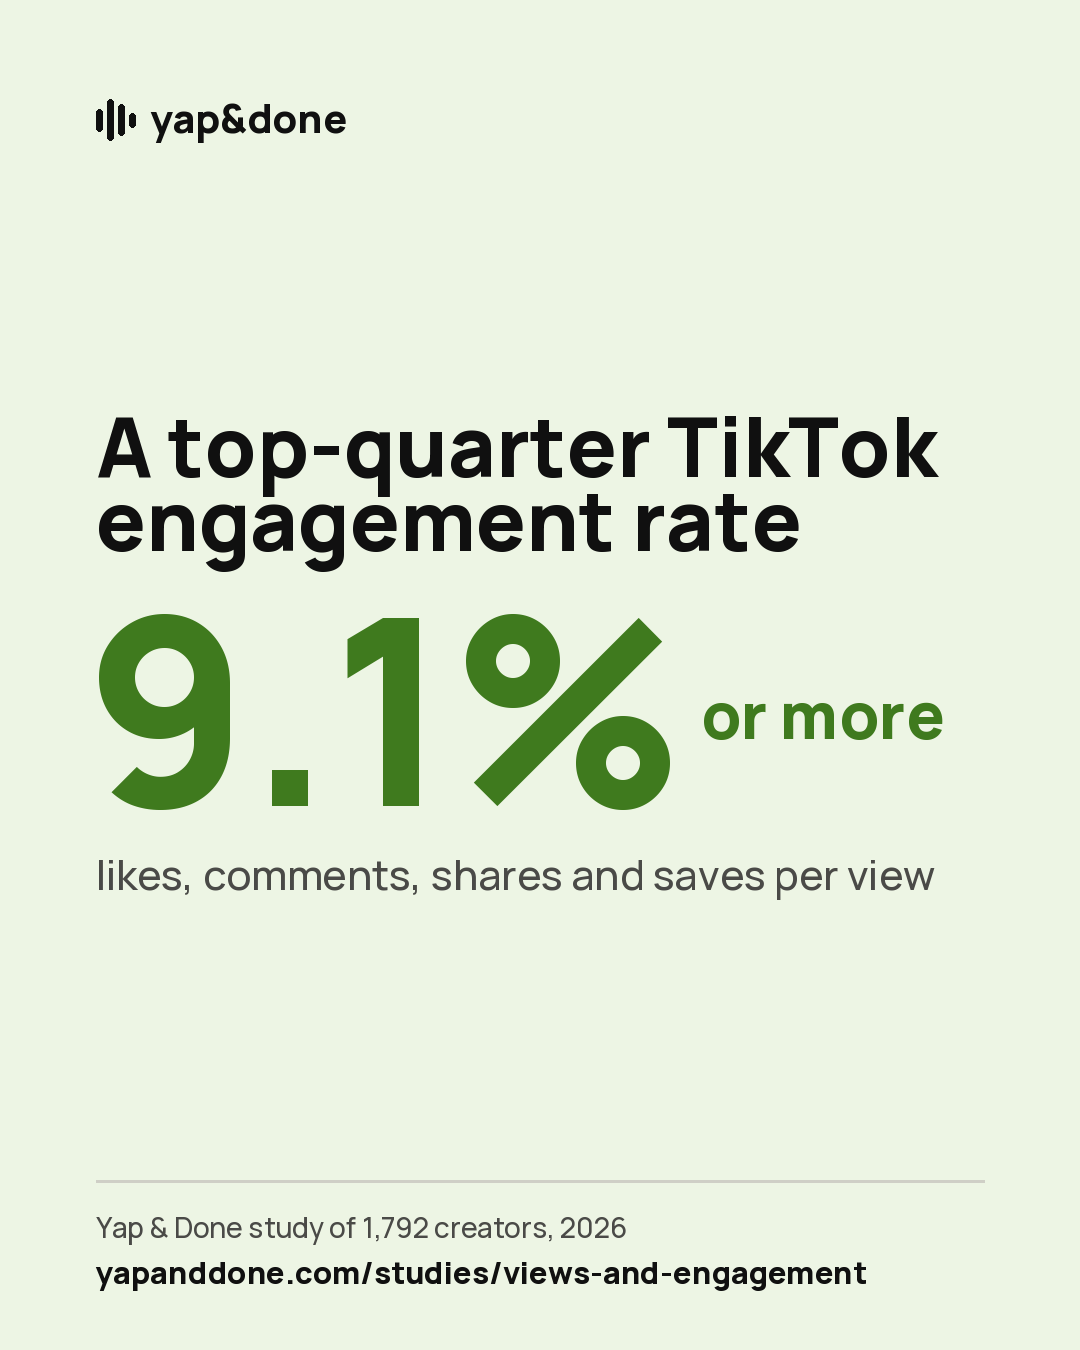
6.4%is the typical TikTok engagement rate. 9.1% or more puts you in the top quarter.

Is 1,000 views good? What engagement rate should you aim for? We measured 1,792 creators of every size, from under 1,000 followers to over a million, on their videos from July to October 2026.
The top lessons you can use
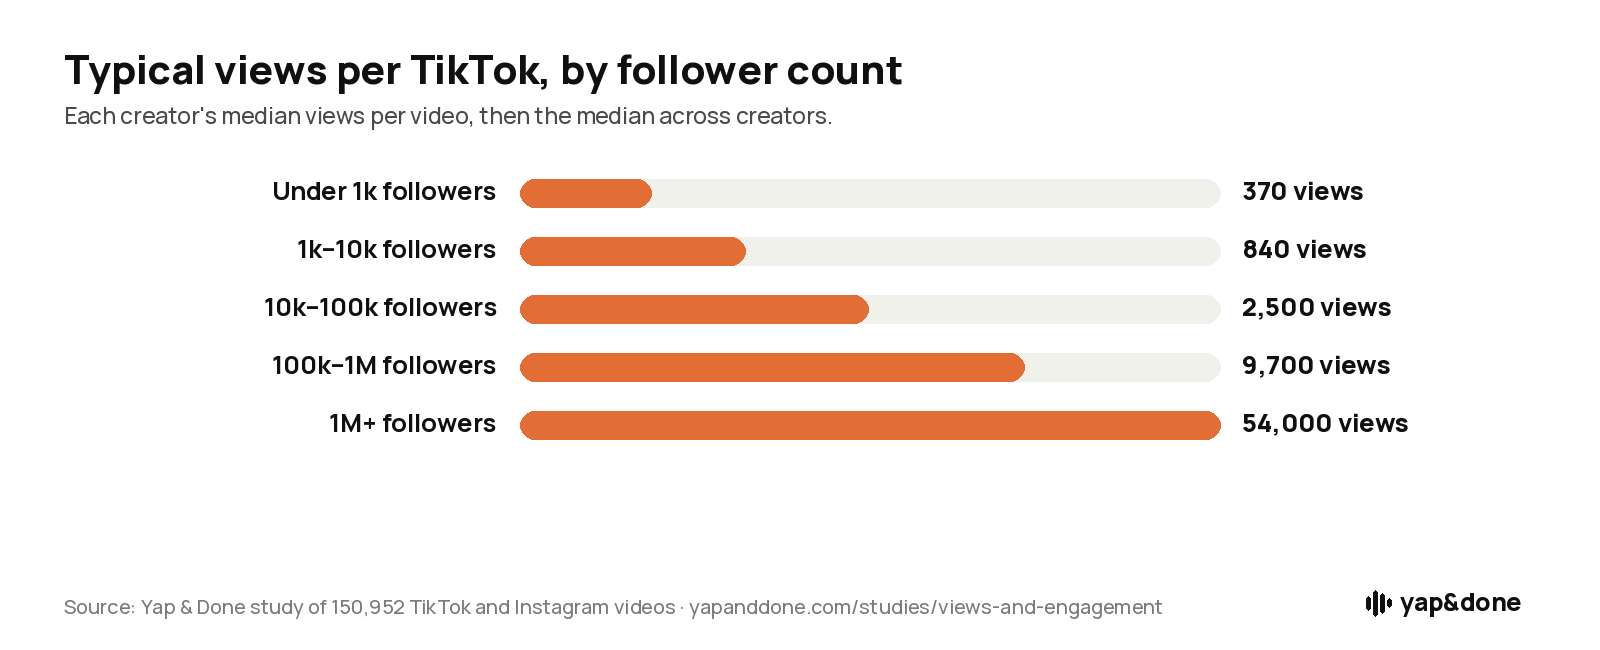
- Compare yourself with creators your size. The typical TikTok gets about 370 views under 1k followers, 840 at 1k–10k, 2,500 at 10k–100k, 9,700 at 100k–1M and 54,000 at 1M+.
- Measure engagement per view, not per follower. The typical TikTok creator gets 6.4% (likes, comments, shares and saves per view); 9.1% or more puts you in the top quarter.
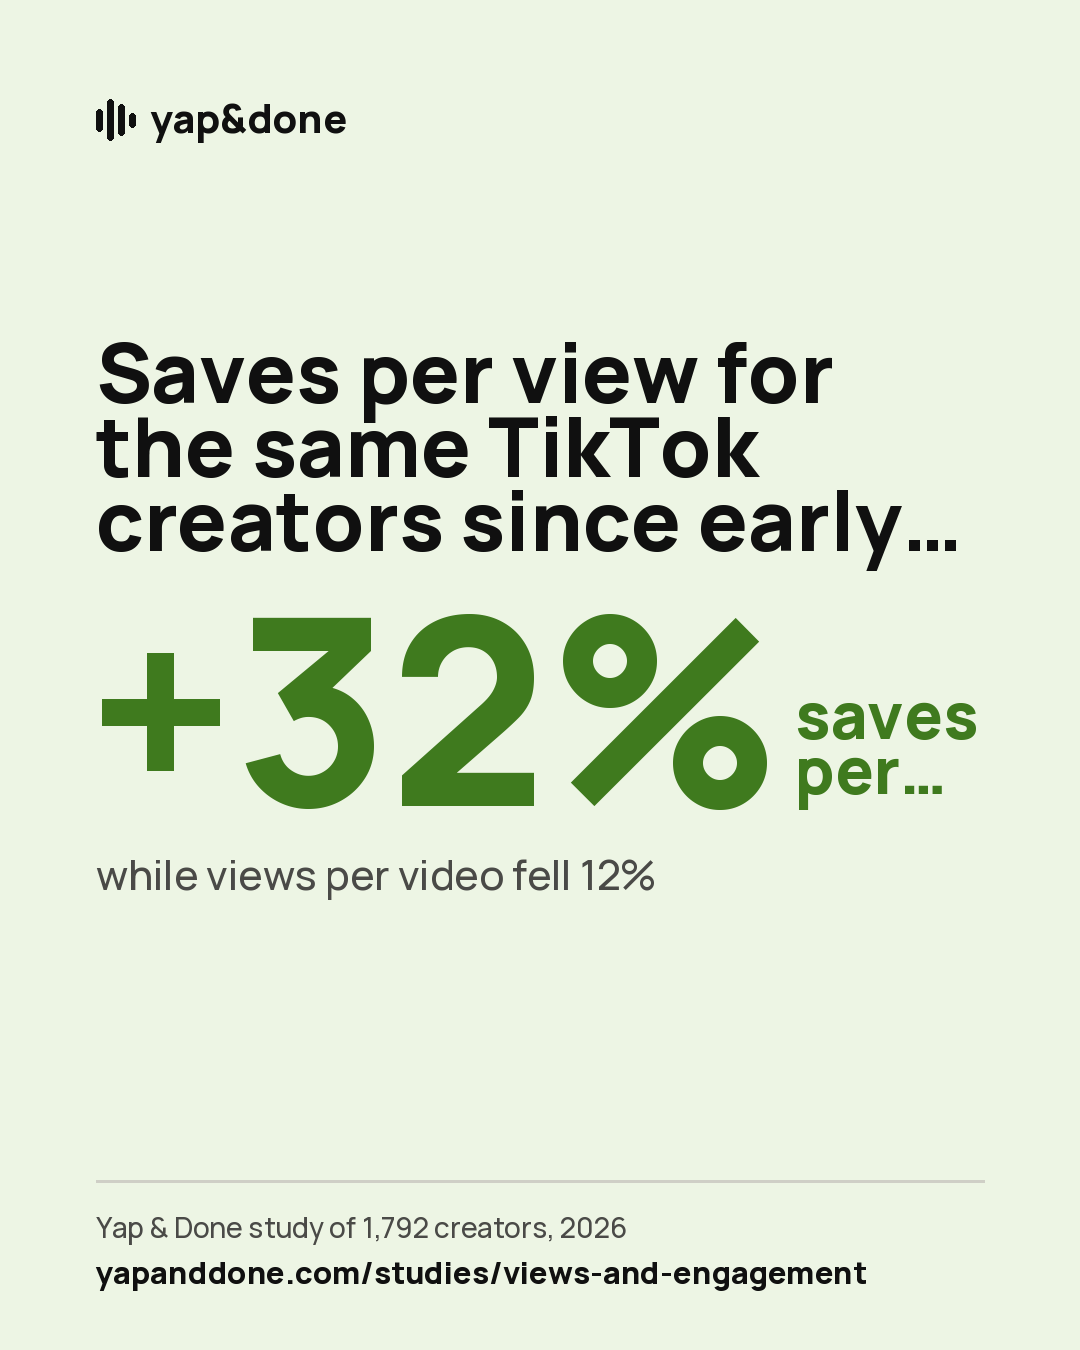
- Watch your saves and shares. The typical TikTok is saved by 0.66% and shared by 0.17% of viewers, and for the same creators saves per view rose 32% and shares per view 11% since early 2025 while views fell 12%.
- Expect lower numbers on Instagram. The typical Reel gets 2% likes and comments per view; 3% or more is top quarter.
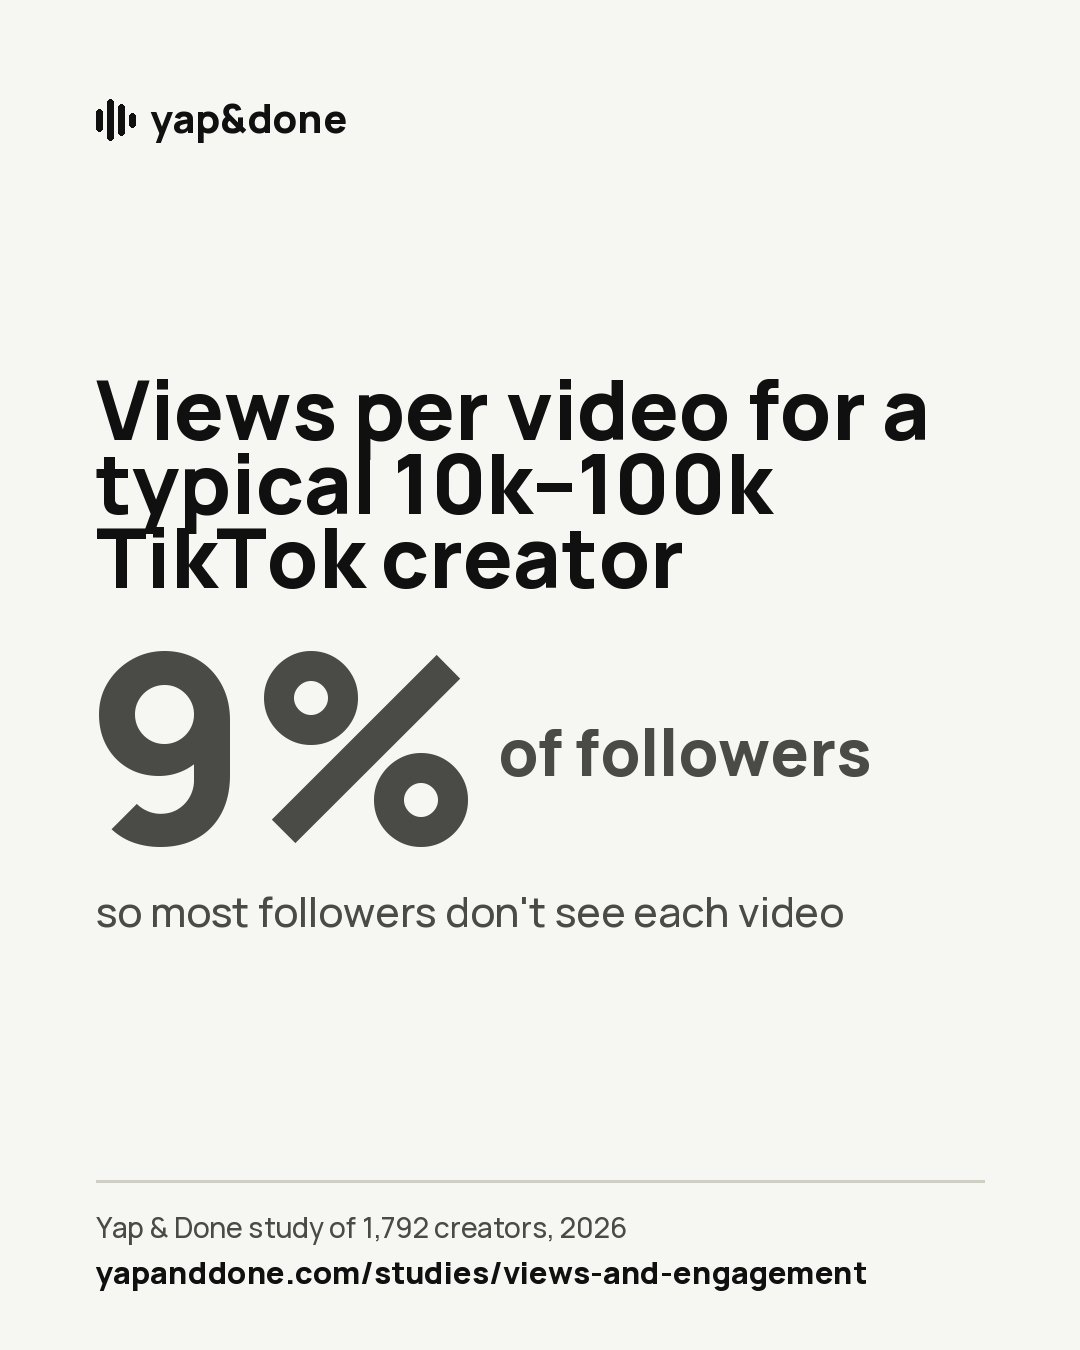
- Don't expect every follower to see every video. A typical 10k–100k creator gets views equal to about 9% of their followers per video; at 100k–1M, about 4%.
Key points
The typical TikTok creator gets about 1,600 views a video: 370 under 1k followers, 2,500 at 10k–100k and 54,000 at 1M+.
Typical TikTok engagement is 6.4% of views; the top quarter get 9.1% or more, the top 10% 12.6% or more.
For the same creators since early 2025: views per video −12%, engagement per view +16%, saves per view +32%, shares per view +11%.
Views per video as a share of followers: 26% at 1k–10k, 9% at 10k–100k, 4% at 100k–1M.
The typical Reel gets 2% likes and comments per view, and about 5,400 views.
On the typical TikTok, 4.7% of viewers like it, 0.66% save it, 0.17% share it and 0.13% comment.
The specifics
The typical TikTok gets about 1,600 views
We took each creator's typical (median) views per video over July to October 2026. Across creators, the middle half got between 590 and 7,400. By follower count: under 1k, 370; 1k–10k, 840; 10k–100k, 2,500; 100k–1M, 9,700; 1M+, 54,000.
A good TikTok engagement rate is 9.1% or more
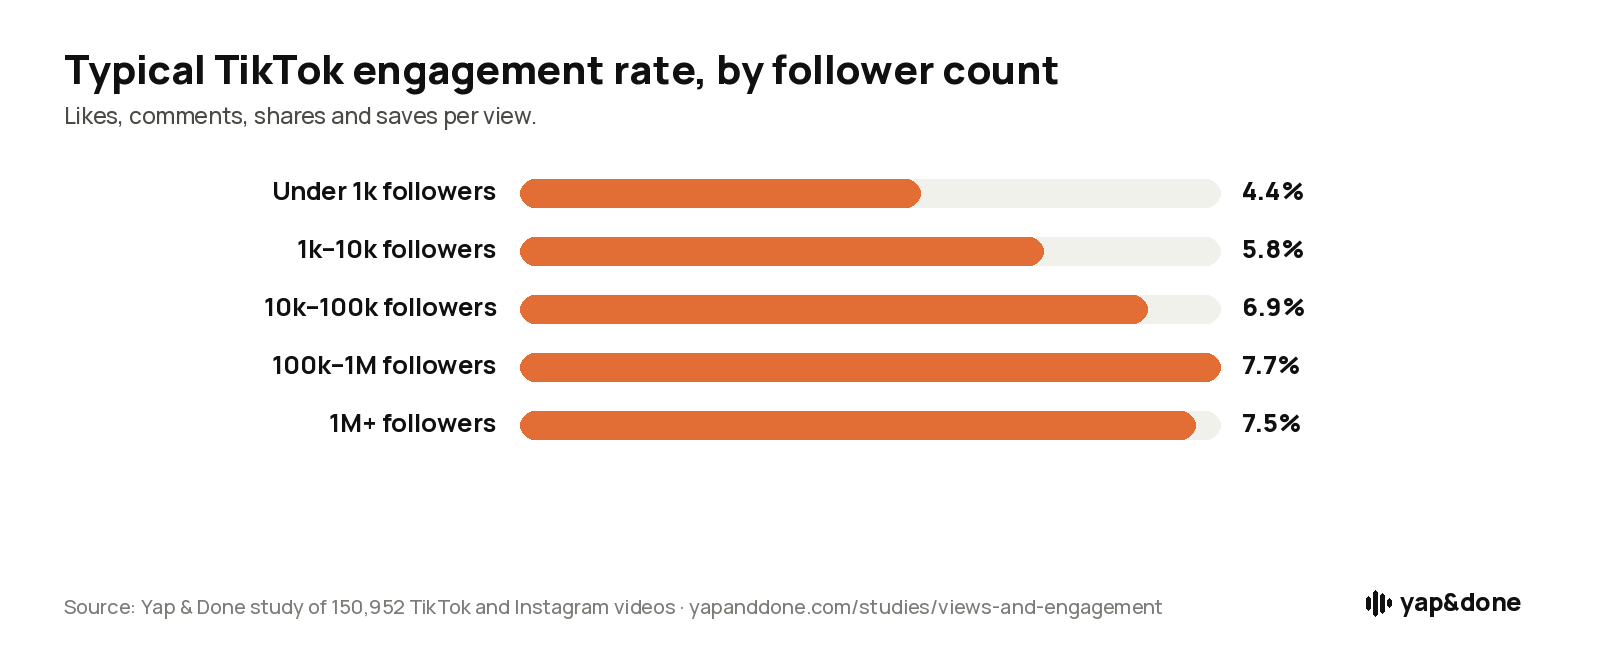
Counting likes, comments, shares and saves per view, the typical creator gets 6.4%. The top quarter get 9.1% or more and the top 10% 12.6% or more. Bigger accounts engage slightly more per view (7.7% at 100k–1M against 4.4% under 1k).
Fewer views, but more engaged viewers
For 559 creators we could follow since early 2025, typical views per video fell 12%, but engagement per view rose 16%, and saves per view rose 32%. Shares per view rose 11%; comments per view barely changed. That fits TikTok showing each video to fewer, more interested viewers.
Your followers don't all see your videos
Typical views per video as a share of followers: 26% for creators with 1k–10k followers, 9% at 10k–100k, 4% at 100k–1M and 2% at 1M+. Bigger accounts reach a smaller share of their followers.
On Instagram, 2% engagement is typical
Reels get far fewer likes and comments per view than TikToks: the typical creator gets 2%, the top quarter 3% or more. Instagram doesn't report saves and shares here, so this counts likes and comments only.
How many views is normal for your size
Each creator's median views per video over July to October 2026, then the spread across creators with the same number of followers.
| Followers | Typical | Top quarter | Top 10% | Views as share of followers | Creators |
|---|---|---|---|---|---|
| All creators | 1,600 | 7,400+ | 26,000+ | – | 1,576 |
| Under 1k | 370 | 660+ | 1,100+ | – | 274 |
| 1k–10k | 840 | 1,700+ | 3,900+ | 26% | 402 |
| 10k–100k | 2,500 | 7,800+ | 18,000+ | 9% | 524 |
| 100k–1M | 9,700 | 28,000+ | 64,000+ | 4% | 311 |
| 1M+ | 54,000 | 91,000+ | 244,000+ | 2% | 65 |
TikTok. "Top quarter" means a creator whose typical video gets at least this many views is ahead of 75% of creators their size.
A good engagement rate
Likes, comments, shares and saves per view: each creator's typical video, then the spread across creators.
| Followers | Engagement (typical) | Top quarter | Likes | Comments | Shares | Saves |
|---|---|---|---|---|---|---|
| All creators | 6.4% | 9.1%+ | 4.7% | 0.13% | 0.17% | 0.66% |
| Under 1k | 4.4% | 6.9%+ | 3.4% | 0.00% | 0.00% | 0.23% |
| 1k–10k | 5.8% | 8.5%+ | 4.4% | 0.17% | 0.14% | 0.48% |
| 10k–100k | 6.9% | 9.5%+ | 5.1% | 0.14% | 0.22% | 0.93% |
| 100k–1M | 7.7% | 11.1%+ | 5.9% | 0.12% | 0.21% | 0.95% |
| 1M+ | 7.5% | 10.9%+ | 5.9% | 0.09% | 0.24% | 0.91% |
TikTok, per view. Engagement per follower would mix up how many people saw a video with how much they liked it, because most viewers don't follow you.
Reels get less engagement per view
The same benchmarks for Instagram Reels. Instagram doesn't report saves and shares here, so engagement is likes and comments per view.
| Followers | Typical views | Top quarter | Engagement (typical) | Top quarter | Creators |
|---|---|---|---|---|---|
| All creators | 5,400 | 29,000+ | 2% | 3%+ | 216 |
| 1k–10k | 1,300 | 2,500+ | 2% | 3.1%+ | 41 |
| 10k–100k | 4,100 | 8,500+ | 1.9% | 2.7%+ | 91 |
| 100k–1M | 32,000 | 69,000+ | 2.3% | 3.2%+ | 66 |
Too few Instagram creators under 1k or over 1M followers to report those groups.
Fewer views, but more engaged viewers
The same 559 TikTok creators, quarter by quarter, against January–March 2025: views per video, and engagement and saves per view.
Change from the first quarter of 2025 to the third quarter of 2026: views per video −12%, engagement per view +16%, saves per view +32%, shares per view +11%, comments per view +0%.
Short answers from this study
Questions people ask
What is a good engagement rate on TikTok?
Above 9.1% of views (likes, comments, shares and saves) puts you in the top quarter of creators; the typical creator gets 6.4%.
How many views is good on TikTok?
It depends on your size. Typical views per video: 370 under 1k followers, 840 at 1k–10k, 2,500 at 10k–100k, 9,700 at 100k–1M, 54,000 at 1M+.
What is a good engagement rate on Instagram Reels?
Above 3% likes and comments per view is top quarter; the typical creator gets 2%.
Why calculate engagement per view and not per follower?
Most viewers on TikTok and Reels don't follow you, so engagement per follower mixes up how many people saw the video with how much they liked it.
Is engagement going down on TikTok?
Not per view. For the same creators since early 2025, views per video fell 12%, but engagement per view rose 16% and saves per view 32%.
Images to post, repost and embed
Free to use under CC BY 4.0. Keep the credit on the image, and link to yapanddone.com/studies/views-and-engagement when you can. Feed cards are 4:5 for Instagram and LinkedIn; story cards are 9:16 for TikTok, Reels and Stories.



Charts for articles


Your average video isn't the whole story
Our other studies look at whether followers still matter and how often videos break out.
Does having followers actually get you more views? How often do videos actually go viral?How we did it
- Creators: the same 1,576 TikTok and 216 Instagram creators as our follower and posting studies, in 10 niches, grouped by follower count in November 2026. Each needed at least 5 videos posted July to October 2026 (videos under 14 days old left out, along with pinned videos and the video we first found them through).
- Per creator: the median views per video, and the median of each rate (likes, comments, shares and saves per view, and their sum as the engagement rate; on Instagram, likes and comments only). "Typical" is the median across creators; "top quarter" and "top 10%" are the 75th and 90th percentiles.
- Trend: 559 TikTok creators with at least 3 videos in every quarter from January 2025 to September 2026. Each creator's quarterly median against their own average quarter, averaged across creators, relative to January–March 2025.
Limitations
- Talking-head creators in 10 niches found through searches, so they're creators with at least some traction; other kinds of accounts may differ.
- Follower counts are from November 2026; views come from the three months before.
- Instagram groups under 1k and over 1M followers had too few creators to report.
Use it, cite it
The aggregated results are free to reuse under CC BY 4.0. Journalists, researchers and AI agents can pull the full numbers below; the plain-text summary contains the whole study.
Cite as
Press questions or a custom cut of the data (a niche, a platform, an account size): contact us. We refresh this study each quarter; this page always shows the latest snapshot.